
A Really Rough Forecast for Democrats. Probably.
- Seth Masket

- May 19, 2022
- 4 min read
A few months ago, I did a simple forecast model for the 2022 midterms, suggesting Democrats were in for a rough year. We have some newer economic data since then, and the model looks considerably worse for the Democrats. But there's an important caveat, so please read on.
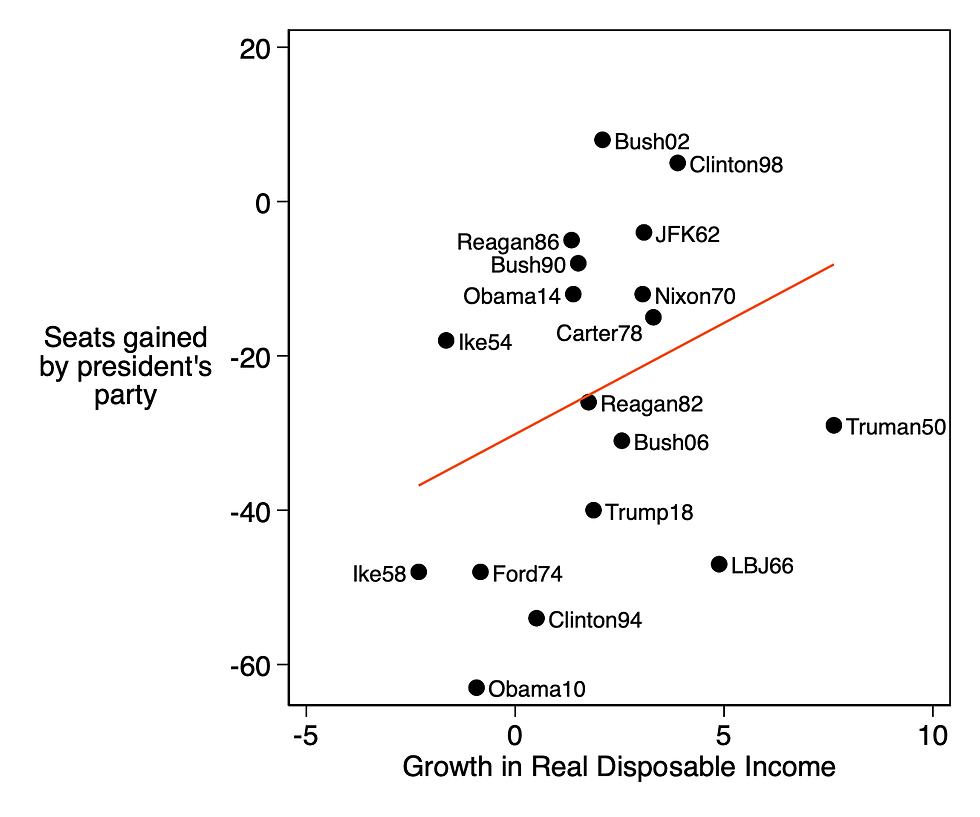
One thing we know influences congressional midterm elections is the state of the economy. There are a lot of ways to measure the economy, but one of the most reliable for predicting elections is per capita real disposable income (RDI). In the chart below, we can see how RDI relates to seat gains in the U.S. House for the president's party since 1950. Here I'm using RDI growth from the second quarter of the year before the election to the first quarter of the election year. (I'll update later this year as we get more recent data.) Obviously, the president's party almost always loses ground, but it seems to be able to mitigate some of that with a stronger economy.
RDI is a somewhat noisy predictor of elections by itself, but if we add in a few other variables -- the president's Gallup approval rating on Labor Day of the election year and the number of seats his party currently controls -- we get a decent amount of explanatory power. The adjusted R-squared here is .54, meaning these three variables explain 54 percent of the variation in seat gains and losses. (Data available here.) Below is the regression output:

So we have a formula, and all we have to do is plug in the values. Let's assume that Biden will be at 41 percent approval on Labor Day, since he's been mired around that for months. And the Democrats currently have 221 seats. The value for RDI growth is -3.2.
Hold on, how is RDI growth -3.2? We're not in a recession. Why does RDI appear to be shrinking? Actually, that's the lowest figure for any midterm election in the above graph, worse even than when Democrats got wiped out in 2010 or when Republicans took a bath in 1958. How is RDI so low?
Democrats can argue that the economy is strong and Republicans can argue the economy is weak and neither would be lying.
There are a number of good reasons for this. One is that we had an expanded child tax credit in place last spring -- parents were getting extra money from the government to help them meet expenses during the pandemic, a product of Biden's American Rescue Plan. Congress failed to extend that. So quite simply, many Americans simply have less take-home money now than they did last spring. Another factor is inflation. RDI takes account of inflation, and Americans have less to spend as a result of it.
Okay, so plugging these numbers into the formula, we get:
seats gained = -52.5 + 5.5*(-3.2) + 1.3*(41) - 0.2*(221)
This equals -64, meaning Democrats can expect to lose around 64 House seats.
64!!! That would be one of the largest shellackings in history, bigger even than the losses to Obama's Democrats in 2010. If you're wondering why recent polls look so bad for Democrats this fall, this economic story really covers it. Or at least it offers a better explanation than "Democrats are too woke" or "They talk like college professors" or something like that.
(As I noted in my last post on this, there are plenty of important factors not included in this model, such as polarization, recent redistricting, and more. Don't take 64 seats to the bank. Rather, think of it as a baseline assumption of where things are given the economy and Biden's popularity.)
So, should Republicans just start moving into the majority offices now? Well, there's an important caveat. RDI isn't the only useful measure of economic activity. What if we use gross domestic product (GDP) instead? Over the same time span, GDP has increased by 10.6 percent. That's actually the biggest improvement for any midterm year in this time period. If we use that instead of RDI in our midterm forecast, Democrats are projected to lose only 11 seats. Yes, they only need to lose four to lose control of the House, but the error term in this forecast means holding the House is not unreasonable. If Biden's approval rating were to nudge up to 47 percent, the odds are even for them to hold the chamber.
Check out the scatterplot below, which shows GDP and RDI plotted against each other. Normally they track each other pretty closely, correlating at .69. But 2022 is a weird outlier, with the highest GDP growth and lowest RDI growth in a midterm year since WWII. Democrats can argue that the economy is strong and Republicans can argue the economy is weak and neither would be lying.

The question, then, is which economic indicator is a better measure of what Americans are experiencing from day to day, and what they will apply to their voting decision this fall. RDI has tended to be the more reliable measure for forecasting elections, and the polling so far is consistent with what RDI is telling us. But RDI and GDP are just never this far apart from each other. There's clearly enough puzzling about this year and its economic record that we shouldn't be too confident in any of these forecasts.


Comments